Crayonbird
Menu

Maths · Ages 7–8 · 55 minutes

Tally charts and bar charts

Children collect data with a tally chart, draw a bar chart from it with a labelled scale, and answer "how many more" questions from the chart.

Success criteria

  • I can record data with tally marks in fives
  • I can draw a bar chart with a labelled axis
  • I can answer how many more questions

Key vocabulary

  • data
  • tally
  • tally chart
  • bar chart
  • axis
  • scale
  • most
  • least
  • how many more

You will need

  • squared paper
  • rulers
  • coloured pencils
  • a large tally chart on the board
  • sticky notes
  • Year 3· England
  • Grade 2· United States
  • Primary 3· Nigeria
  • Class 3· India

Practice sheets

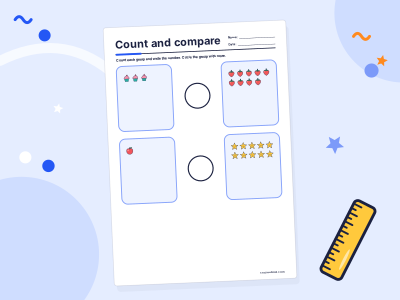
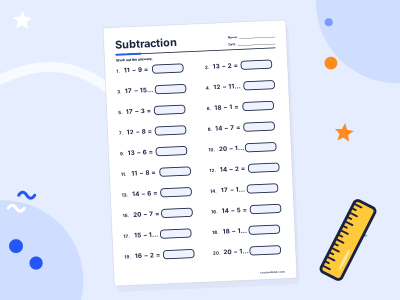
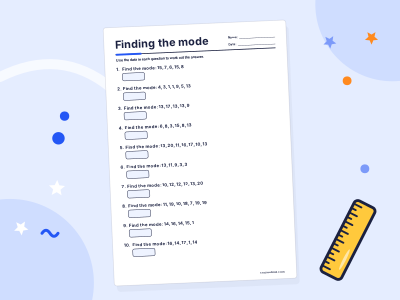
Generated fresh each time you press a button, and marked instantly on screen.

The lesson at a glance

55 minutes in all. Timings are a guide: follow your class.

  1. Step 1: Starter

    Ask the class: "Which fruit do most children in our class like best?" Take a few guesses.
    7 minutes
  2. Step 2: Teach

    Draw a tally chart with four rows: apple, banana, orange, grapes.
    13 minutes
  3. Step 3: Guided practice

    Give pairs a ready-made tally chart (for example, how pupils travel to school: walk 9, car 6, bus 4, bike 3).
    10 minutes
  4. Step 4: Independent practice

    Children first finish their own bar chart from the class fruit data (10 minutes), then use the practice buttons above.
    20 minutes
  5. Step 5: Plenary

    Show a bar chart with a mistake: no label on the side and one bar that starts above zero.
    5 minutes
  6. Step 6: Assessment for learning

    Look for children who: draw tally gates correctly and count them in 5s; label both axes and start bars from zero; find "how many more" by subtracting, not by reading the bigger bar alone.
  7. Step 7: Differentiation

    Children who need support can use a scale of one square per vote and a chart with axes already drawn.
  8. Step 8: Common misconceptions

    Drawing five separate lines instead of a gate.
  9. Step 9: Home link

    Make a tally of the colours of cars that pass your window in five minutes and ask which colour came up most.

1.Starter

7 minutes

Ask the class: "Which fruit do most children in our class like best?" Take a few guesses. "How could we find out properly, without everyone shouting at once?" Steer towards asking everyone and keeping count.

  • apple
  • banana
  • orange
  • grapes
Four fruit choices keep the data small enough to count.

2.Teach

13 minutes

Draw a tally chart with four rows: apple, banana, orange, grapes. Ask each child to vote with a sticky note, then record each vote as a tally mark while the class watches.

"One mark for each vote. When I get to five, I draw a line across the first four. That makes a gate. Gates let us count in 5s." Count the totals together: "5, 10, 11, 12. Twelve for apples."

Now turn it into a bar chart on squared paper. "Up the side is the scale: how many votes. Along the bottom are the fruits. Each bar goes up to the number of votes."

Step by step

  1. Tally in fivesFour marks, then a line across for the fifth.
  2. Draw the axesLabel the bottom with the categories and the side with the numbers.
  3. Draw the barsSame width, gaps between them, tops level with the total.
  4. Ask questionsWhich is most popular? How many more chose apples than grapes?

"How many more chose apples than grapes? Apples got 12, grapes got 5. I find the difference: 12 − 5 = 7. Seven more children chose apples."


The rest of the plan

Guided and independent practice, the plenary, assessment for learning, differentiation, common misconceptions and the home link are free with a Crayonbird account.

  1. Guided practice10 minutes
  2. Independent practice20 minutes
  3. Plenary5 minutes
  4. Assessment for learning
  5. Differentiation
  6. Common misconceptions
  7. Home link

Learning Wiki

Pictograms

A pictogram shows data using small pictures or symbols. A key tells you what each picture is worth, such as one apple standing for 2 apples. In the US it is often called a picture graph.

Subtraction

Subtraction is taking one amount away from another, or finding the difference between two numbers. The sign is −, so 9 − 4 = 5.

Telling the time

To tell the time on a clock, read the short hand for the hour and the long hand for the minutes. When the long hand points to 6, it is half past the hour.

  • Maths · Ages 7–8 · 50 min

    Column addition with exchanging

    Children add two-digit numbers using the column method, lining up digits by place value and exchanging ten ones for one ten.

  • Maths · Ages 7–8 · 50 min

    Division as sharing and grouping

    Children solve division by sharing into equal groups and by making groups of a given size, and use multiplication facts to find the answer faster.

  • Maths · Ages 7–8 · 50 min

    Measuring length in centimetres and metres

    Children measure lengths accurately with a ruler starting from zero, record them in centimetres and metres, and add lengths to find a total.