Maths
What is a tally chart?
Quick answer
A tally chart is a table that counts things with little marks. Each mark is one, and every fifth mark crosses the four before it, so you can count in fives.


In one sentence
A tally chart records how many times something happens by drawing one small line for each, grouped in fives.
Explained
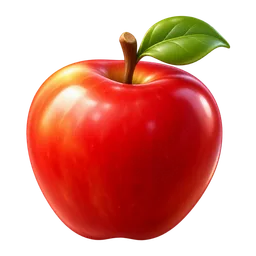
Imagine your class votes for a favourite fruit. You could write the names down, but it is hard to count a long list. A tally chart makes it easy. You make a table with one row for each choice. Every time someone chooses an item, you draw one short line beside it.
After four lines, the fifth goes across the first four, like a gate. That bundle stands for five. Grouping in fives means you can count by skipping: 5, 10, 15, and then add on the single lines at the end.
 pencil
 notebook
 apple
- Apple: ||||/ ||| which is 5 + 3 = 8
- Banana: ||||/ which is 5
- Grape: |||| which is 4
(The slash after four lines shows the fifth line crossing the group.)
Once you have the totals, you can see which fruit won, which is the least popular, and how many people answered altogether (8 + 5 + 4 = 17). A tally chart is often the first step. You can then draw the results as a bar chart or a pictogram.
Tally charts are best when information arrives bit by bit: counting cars passing the school gate, or how many times each side of a dice lands in 30 rolls. Mark each result as it happens so nothing is missed or counted twice. This also helps your counting.
Examples
| Task | What you tally |
|---|---|
| Class vote | favourite pets |
| Traffic survey | cars, bikes and buses |
| Dice game | each number rolled |
| Weather diary | sunny, cloudy and rainy days |
Common mistakes
- Forgetting to cross the fifth line. The bundle only works if every fifth mark crosses the group.
- Making groups of different sizes. Always five.
- Counting twice or missing one. Tally as you go, and add up the total row to check.
Quick quiz
Tally charts
Check what you know with 4 quick questions.
Question 1 of 4
How is the number 5 drawn in a tally?
Practise it
Try it
Charts and data practice


Practise it step by step in a full course: Grade 2 Maths
For grown-ups
Related topics

Bar charts
A bar chart shows data using bars of different lengths. The longer the bar, the bigger the number. In the US it is usually called a bar graph.
Pictograms
A pictogram shows data using small pictures or symbols. A key tells you what each picture is worth, such as one apple standing for 2 apples. In the US it is often called a picture graph.

Counting
Counting means saying one number for each thing in a group, in order, to find out how many there are. The last number you say is the total.
Line graphs
A line graph shows how something changes over time. Points are plotted on a grid and joined by a line, so you can see rises, falls and patterns at a glance.

Pie charts
A pie chart is a circle divided into slices that show parts of a whole. A bigger slice means a bigger share, and all the slices together make 100 percent, or 360 degrees.

Venn diagrams
A Venn diagram uses overlapping circles to sort things into groups. The overlap shows what belongs to both groups, and the outside shows what belongs to neither.