Maths
What is cumulative frequency, and how do you find it?
Quick answer
Cumulative frequency is a running total of frequencies. Add each frequency to the total so far; the last value equals the total, and a cumulative frequency graph gives the median and quartiles.



In one sentence
Cumulative frequency is a running total: for each value or class, it tells you how many results are at that value or below it.
Explained
Imagine counting how many minutes 80 students spent on homework last night. A normal frequency table tells you how many students are in each group, such as "between 20 and 30 minutes". A cumulative frequency table answers a different question: how many students spent 30 minutes or less? To get it, you keep adding the frequencies as you go down the table, like a score that keeps building up.
 clock
 notebook
 pencil
The rule is simple:
cumulative frequency = this frequency + the cumulative frequency of the row before
The first cumulative frequency is just the first frequency. The last cumulative frequency always equals the total number of results, which is a quick way to check your adding. The data often comes from a tally chart.
Why bother? Running totals make some questions very fast. "How many students spent 20 minutes or less?" becomes a single look at the table. They also let you find the median and the quartiles of a large set of grouped data, where you cannot list every value.
Cumulative frequency graph. For grouped data, plot each cumulative frequency at the upper class boundary (the end of the class), because by then everyone in that class has been counted. Start at the bottom of the first class with a cumulative frequency of 0. Join the points with a smooth curve (a cumulative frequency curve, also called an ogive) or with straight lines (a cumulative frequency polygon). The graph always rises or stays level from left to right, often in a stretched S shape.
To read the graph, go across from a cumulative frequency to the curve, then down to the horizontal axis. With n results:
- the median is at n ÷ 2,
- the lower quartile is at n ÷ 4,
- the upper quartile is at 3n ÷ 4,
- the interquartile range (IQR) is upper quartile − lower quartile. It measures the spread of the middle half of the data.
Values read from a graph of grouped data are estimates, because you do not know exactly where each value sits inside its class. This links closely to mean, median and mode and to histograms, which show the same grouped data as bars.
Examples
Homework times for 80 students:
| Time t (minutes) | Frequency | Cumulative frequency | Point to plot |
|---|---|---|---|
| 0 < t ≤ 10 | 6 | 6 | (10, 6) |
| 10 < t ≤ 20 | 14 | 6 + 14 = 20 | (20, 20) |
| 20 < t ≤ 30 | 20 | 20 + 20 = 40 | (30, 40) |
| 30 < t ≤ 40 | 20 | 40 + 20 = 60 | (40, 60) |
| 40 < t ≤ 50 | 15 | 60 + 15 = 75 | (50, 75) |
| 50 < t ≤ 60 | 5 | 75 + 5 = 80 | (60, 80) |
Also plot (0, 0). Worked example: n = 80, so read the median at 40, the lower quartile at 20 and the upper quartile at 60. The graph passes through (30, 40), (20, 20) and (40, 60), so the median is 30 minutes, the lower quartile is 20 minutes, the upper quartile is 40 minutes and the IQR is 40 − 20 = 20 minutes. The table also shows that 80 − 75 = 5 students spent more than 50 minutes.
For ungrouped (discrete) data, the running total finds the median directly. Pets owned by 30 students: 0 pets: 8, 1 pet: 10, 2 pets: 7, 3 pets: 3, 4 pets: 2. Cumulative frequencies: 8, 18, 25, 28, 30. The median is between the 15th and 16th values; both are in the "1 pet" row (the 9th to 18th values), so the median is 1 pet.
Common mistakes
- Plotting at the midpoint of the class. Fix: cumulative frequency goes at the upper class boundary. Midpoints are for estimating the mean or for frequency polygons.
- Forgetting the starting point. Fix: plot a cumulative frequency of 0 at the start of the first class, so the curve begins on the axis.
- Reading the median at the wrong height. Fix: read across from n ÷ 2 on the vertical axis, then down. Do not take the middle of the horizontal axis.
- Giving the class instead of a value. Fix: the median is a number such as 30 minutes, not "the 20–30 class".
Step by step
Step by step
- Add a columnNext to the frequencies, make a column headed "cumulative frequency".
- Keep a running totalCopy the first frequency, then add each new frequency to the total above it.
- Check the last valueIt must equal the total frequency n.
- Plot the pointsPlot each running total at the upper class boundary, plus 0 at the start of the first class. Join them with a smooth curve or straight lines.
- Read the graphGo across from n ÷ 2 for the median, n ÷ 4 and 3n ÷ 4 for the quartiles, then down to the axis.
To go backwards, subtract: the frequency of a class is its cumulative frequency minus the one before it.
Practice questions
Cumulative frequency
Try each one, then check your answer.
- The frequencies are 3, 5, 2 and 6. Write the cumulative frequencies.
Show answer
3, 3 + 5 = 8, 8 + 2 = 10, 10 + 6 = 16: 3, 8, 10, 16 - Shoe sizes: size 3: 4 students, size 4: 7, size 5: 9, size 6: 5. What is the cumulative frequency for size 5?
Show answer
4 + 7 + 9 = 20 - In question 2, how many students are there altogether?
Show answer
20 + 5 = 25 (the last cumulative frequency) - The cumulative frequencies are 5, 12, 20, 26, 30. What is the frequency of the third class?
Show answer
20 − 12 = 8 - In question 4, what is the frequency of the last class?
Show answer
30 − 26 = 4 - A cumulative frequency graph shows 60 values. At which cumulative frequency do you read the median?
Show answer
60 ÷ 2 = 30 - For the same 60 values, where do you read the quartiles?
Show answer
Lower quartile at 60 ÷ 4 = 15, upper quartile at 3 × 60 ÷ 4 = 45 - The lower quartile is 24 and the upper quartile is 38. Find the IQR.
Show answer
38 − 24 = 14 - Scores of 25 students: score 1: 2, score 2: 5, score 3: 8, score 4: 6, score 5: 4. Find the median.
Show answer
Cumulative: 2, 7, 15, 21, 25. The 13th value is in the score-3 row (8th to 15th), so the median is 3 - In question 9, what percentage of students scored 4 or less?
Show answer
21 ÷ 25 = 0.84 = 84% - Heights: 140 < h ≤ 150: 5, 150 < h ≤ 160: 15, 160 < h ≤ 170: 12, 170 < h ≤ 180: 8. Which points do you plot?
Show answer
Cumulative 5, 20, 32, 40: (140, 0), (150, 5), (160, 20), (170, 32), (180, 40) - Goals in 20 matches: 0 goals: 3, 1 goal: 6, 2 goals: 5, 3 goals: 4, 4 goals: 2. Find the median.
Show answer
Cumulative: 3, 9, 14, 18, 20. The 10th and 11th values are both in the 2-goal row, so the median is 2 goals - A cumulative frequency graph for 40 values passes through (20, 10), (30, 20) and (40, 30). Estimate the median and the IQR.
Show answer
Median at 20: 30. Quartiles at 10 and 30: 20 and 40, so IQR = 40 − 20 = 20 - In question 13, the graph also passes through (50, 36). How many values are more than 50?
Show answer
40 − 36 = 4 - 120 students sat a test and the cumulative frequency at 60 marks is 90. What percentage scored 60 marks or less?
Show answer
90 ÷ 120 = 0.75 = 75%
Word problems
Cumulative frequency in real life
Try each one, then check your answer.
- A shop sells 12 bikes on Monday, 15 on Tuesday, 9 on Wednesday and 14 on Thursday. On which day did the total sales first pass 30?
Show answer
Running totals 12, 27, 36, 50: Wednesday - In a race, 150 of the 200 runners finished within 4 hours. How many took longer, and what percentage finished within 4 hours?
Show answer
200 − 150 = 50 runners; 150 ÷ 200 = 75% - 80 students sat an exam and 28 of them scored 50 marks or less. To pass you need more than 50. How many passed?
Show answer
80 − 28 = 52 students - Battery brand A has median 38 hours and IQR 9 hours. Brand B has median 36 hours and IQR 4 hours. Which brand is more consistent?
Show answer
Brand B: its smaller IQR means the middle half of its batteries last a more similar time. - Rainfall: January 60 mm, February 45 mm, March 50 mm, April 40 mm. What is the cumulative rainfall by the end of April?
Show answer
60 + 45 + 50 + 40 = 195 mm
Questions people ask
What is the formula for cumulative frequency?
There is no complicated formula: each cumulative frequency is the frequency of that row plus the cumulative frequency of the row before. The first one equals the first frequency and the last one equals the total.
How do you draw a cumulative frequency graph?
Work out the running totals, then plot each one against the upper class boundary, starting with 0 at the bottom of the first class. Join the points with a smooth curve or straight lines. Put the data values on the horizontal axis and cumulative frequency (0 to n) on the vertical axis.
What is the difference between cumulative frequency and relative frequency?
Relative frequency is one frequency divided by the total, such as 20 out of 80 = 0.25. Cumulative frequency is a running total. Put them together and you get cumulative relative frequency: the running total divided by the total, often given as a percentage (60 out of 80 = 75%).
How do you find the median from cumulative frequency?
For grouped data, read across from n ÷ 2 to the curve and down. For a list of discrete values, find the row where the running total first reaches the middle position. Some courses, such as Class 10 in India, use the formula median = l + ((n ÷ 2 − cf) ÷ f) × h, where l is the lower limit of the median class, cf the cumulative frequency before it, f its frequency and h the class width. For the homework data: 20 + ((40 − 20) ÷ 20) × 10 = 30 minutes.
What is the difference between a cumulative frequency curve and a polygon?
Both use the same points. A curve joins them smoothly, a polygon joins them with straight lines. Readings from the two are very close, and both are estimates for grouped data.
How do you work out cumulative frequency in Excel?
If the frequencies are in B2 to B7, type =SUM($B$2:B2) in C2 and fill it down. The $ signs fix the start of the range while the end moves, so each cell adds up everything so far.
Quick quiz
Cumulative frequency
Check what you know with 4 quick questions.
Question 1 of 4
The frequencies in a table are 4, 6 and 5. What is the last cumulative frequency?
Practise it
Try it
Practise cumulative frequency with unlimited questions
Statistics worksheets
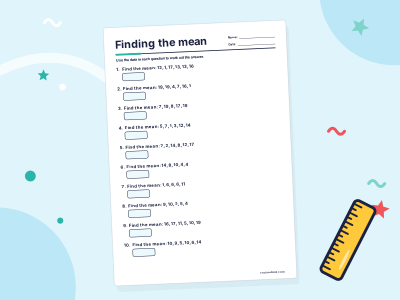
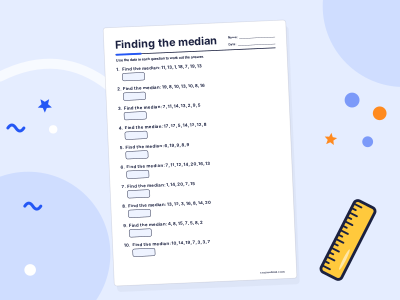
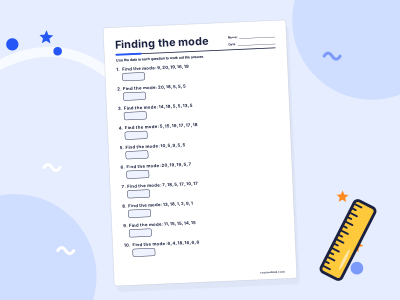
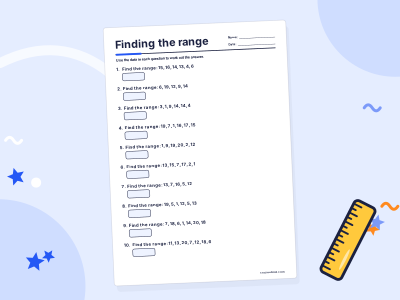
Practise it step by step in a full course: Grade 10 Maths
For grown-ups
Related topics

Histograms
A histogram shows grouped numerical data as touching bars on a number scale, one bar per class. When the classes have different widths, the area of each bar shows the frequency.

Mean, median and mode
Mean, median and mode are three kinds of average. The mean shares the total out equally, the median is the middle value in order, and the mode is the most common value.
Tally charts
A tally chart is a table that counts things with little marks. Each mark is one, and every fifth mark crosses the four before it, so you can count in fives.
Frequency polygons
A frequency polygon is a line graph of a grouped frequency table. Plot each class's frequency above the class midpoint and join the points with straight lines.
Quartiles and interquartile range
Quartiles split ordered data into four equal parts. The interquartile range is the upper quartile minus the lower quartile, IQR = Q₃ − Q₁: the spread of the middle half.

Relative frequency
Relative frequency is how often something happens compared with the total, frequency ÷ total. If 6 of 20 students walk to school, the relative frequency is 6/20 = 0.3, or 30%.