Maths
What are quartiles, and how do you find the interquartile range?
Quick answer
Quartiles split ordered data into four equal parts. The interquartile range is the upper quartile minus the lower quartile, IQR = Q₃ − Q₁: the spread of the middle half.



In one sentence
Quartiles are the three values that cut a set of ordered data into four equal parts, and the interquartile range (IQR) is the gap between the upper and lower quartile: the spread of the middle half of the data.
Explained
Line up eleven pupils by their test mark, lowest to highest. The pupil in the middle has the median mark. Now cut each half in the middle again. You get three cutting points:
- Q₁, the lower quartile (first quartile): a quarter of the data is below it. It is also the 25th percentile.
- Q₂, the median (second quartile): half the data is below it.
- Q₃, the upper quartile (third quartile): three quarters of the data is below it. It is the 75th percentile.
 notebook
 ruler
 magnifying glass
The interquartile range measures how spread out the middle half of the data is:
Interquartile range (IQR) = upper quartile − lower quartile = Q₃ − Q₁
It has the same units as the data: if the data are marks, the IQR is in marks; if they are minutes, it is in minutes.
Why not just use the range (largest − smallest)? Because the range depends on the two most extreme values. One unusual value, called an outlier, can make it huge. The IQR throws away the bottom quarter and the top quarter, so it shows how tightly the typical values are bunched. A small IQR means the middle half of the data is consistent; a large IQR means it is spread out.
The method you will use most (the "median of each half" method, standard in the US and very common in the UK):
- Put the data in order and find the median.
- The lower half is every value below the median; Q₁ is its median.
- The upper half is every value above the median; Q₃ is its median.
If there is an odd number of values, the median itself belongs to neither half. Some books use positions instead: Q₁ is the (n + 1) ÷ 4 th value and Q₃ the 3(n + 1) ÷ 4 th value. When n is 7, 11, 15, 19 and so on (3 more than a multiple of 4), these two methods agree; for other n they can differ a little, and spreadsheet functions such as QUARTILE.INC can differ even then, so use your teacher's method.
Quartiles are the five-number summary behind a box plot: minimum, Q₁, median, Q₃, maximum. The box goes from Q₁ to Q₃, so the length of the box is the IQR. For large or grouped data, read the quartiles from a cumulative frequency graph at n ÷ 4 and 3n ÷ 4. The median and its friends are explained in mean, median and mode, and a measure of spread that uses every value is the standard deviation.
Examples
Worked example: 11 test marks (out of 50) are 18, 22, 25, 27, 30, 31, 33, 36, 38, 41, 45.
- Median: the 6th value, 31.
- Lower half: 18, 22, 25, 27, 30, so Q₁ = 25.
- Upper half: 33, 36, 38, 41, 45, so Q₃ = 38.
- IQR = 38 − 25 = 13 marks. (The range is 45 − 18 = 27 marks.)
| Ordered data | n | Q₁ | Median | Q₃ | IQR |
|---|---|---|---|---|---|
| 2, 4, 5, 7, 9, 10, 13 | 7 | 4 | 7 | 10 | 6 |
| 1, 3, 3, 6, 8, 9, 11, 14, 15, 18, 20 | 11 | 3 | 9 | 15 | 12 |
| 10, 12, 15, 16, 19, 22 | 6 | 12 | 15.5 | 19 | 7 |
| 3, 4, 6, 8, 9, 11, 12, 14, 17, 20 | 10 | 6 | 10 | 14 | 8 |
With an even number of values, the data splits into two equal halves. In the last row the median is (9 + 11) ÷ 2 = 10, the lower half is 3, 4, 6, 8, 9 and the upper half is 11, 12, 14, 17, 20.
Outlier example: pocket money of seven friends is £4, £5, £5, £6, £7, £8, £30. Q₁ = £5 and Q₃ = £8, so the IQR is £3, while the range is £26. The £30 makes the range look enormous, but the IQR shows that most friends get similar amounts.
Common mistakes
- Forgetting to order the data. Quartiles only make sense on sorted data. Fix: rewrite the list in order first and count that you still have n values.
- Putting the median into both halves. With an odd number of values, leave the median out of both halves.
- Giving the quartiles instead of the IQR. "Q₁ = 25 and Q₃ = 38" is not the answer to "find the IQR". Fix: always finish with Q₃ − Q₁ = 13.
- Mixing up IQR and range. The range uses the extremes (max − min); the IQR uses the quartiles (Q₃ − Q₁).
Step by step
Step by step
- OrderWrite the data from smallest to largest and count the values (n).
- Find the medianThe middle value, or the mean of the two middle values if n is even.
- SplitTake the lower half and the upper half (leave the median out if n is odd).
- Find Q₁ and Q₃Q₁ is the median of the lower half, Q₃ the median of the upper half.
- SubtractIQR = Q₃ − Q₁. Add the units and check that Q₁ ≤ median ≤ Q₃.
To test for outliers, a common rule says a value is an outlier if it is more than 1.5 × IQR below Q₁ or above Q₃.
Practice questions
Quartiles and IQR
Try each one, then check your answer.
- Q₁ = 12 and Q₃ = 20. Find the IQR.
Show answer
20 − 12 = 8 - The lower quartile is 3.5 and the upper quartile is 9.2. Find the IQR.
Show answer
9.2 − 3.5 = 5.7 - Find Q₁, the median and Q₃ of 2, 3, 5, 6, 8, 9, 11.
Show answer
Median 6; lower half 2, 3, 5; upper half 8, 9, 11: Q₁ = 3, median = 6, Q₃ = 9 - Find the IQR of the data in question 3.
Show answer
9 − 3 = 6 - Find the IQR of 9, 4, 7, 1, 12, 6, 10.
Show answer
In order: 1, 4, 6, 7, 9, 10, 12. Q₁ = 4, Q₃ = 10: IQR = 6 - Find the quartiles and IQR of 14, 15, 15, 17, 18, 20, 21, 23, 24, 26, 30.
Show answer
Median 20 (6th value); Q₁ = 15, Q₃ = 24: IQR = 9 - Find the IQR of 5, 8, 9, 12, 14, 20.
Show answer
Lower half 5, 8, 9 gives Q₁ = 8; upper half 12, 14, 20 gives Q₃ = 14: IQR = 6 - Find the median and IQR of 21, 23, 24, 26, 27, 29, 31, 32, 35, 40.
Show answer
Median (27 + 29) ÷ 2 = 28; Q₁ = 24, Q₃ = 32: IQR = 8 - A box plot shows minimum 4, Q₁ 10, median 15, Q₃ 22, maximum 30. Find the IQR and the range.
Show answer
IQR = 22 − 10 = 12; range = 30 − 4 = 26 - In the box plot from question 9, what percentage of the data is above 10?
Show answer
10 is Q₁, so 75% of the data is above it. - Q₁ = 20 and Q₃ = 30. Using the 1.5 × IQR rule, is 50 an outlier?
Show answer
IQR = 10, upper limit 30 + 1.5 × 10 = 45. 50 > 45, so yes. - Is 19 an outlier in 3, 4, 4, 5, 6, 7, 19?
Show answer
Q₁ = 4, Q₃ = 7, IQR = 3; upper limit 7 + 4.5 = 11.5. Yes, 19 > 11.5. - Find the IQR of 2, 3, 5, 5, 6, 8, 9, 10, 12, 13, 13, 15, 17, 18, 21.
Show answer
n = 15, median = 8th value = 10; Q₁ = 4th value = 5, Q₃ = 12th value = 15: IQR = 10 - Q₁ = 7 and the IQR is 9. Find Q₃.
Show answer
7 + 9 = 16 - Find the IQR of 5, 5, 5, 5, 5, 5, 9. What does it tell you?
Show answer
Q₁ = 5 and Q₃ = 5, so IQR = 0: the middle half of the data are all the same value.
Word problems
Quartiles in real life
Try each one, then check your answer.
- Class A's test scores have Q₁ = 52 and Q₃ = 70. Class B's have Q₁ = 58 and Q₃ = 64. Which class is more consistent?
Show answer
IQR A = 18, IQR B = 6, so class B (its middle half is closer together). - The midday temperatures one week were 14, 16, 15, 18, 21, 17, 19 °C. Find the IQR.
Show answer
In order: 14, 15, 16, 17, 18, 19, 21. Q₁ = 15, Q₃ = 19: IQR = 4 °C - Sam's bus ride to school took 22, 25, 24, 30, 23, 26, 45, 24, 27, 25, 28 minutes on 11 days. Find the IQR. Is 45 minutes an outlier?
Show answer
In order: 22, 23, 24, 24, 25, 25, 26, 27, 28, 30, 45. Q₁ = 24, Q₃ = 28, IQR = 4 minutes. Upper limit 28 + 6 = 34, so 45 is an outlier (perhaps a traffic jam). - A book costs £8, £9, £9, £10, £11, £12 and £15 in seven shops. Find the IQR.
Show answer
Q₁ = £9, Q₃ = £12: IQR = £3 - A box plot of the heights of 80 sunflowers has Q₁ = 1.2 m and Q₃ = 1.9 m. Find the IQR. How many sunflowers are between 1.2 m and 1.9 m tall?
Show answer
IQR = 1.9 − 1.2 = 0.7 m; half of 80 = about 40 sunflowers.
Questions people ask
What is the interquartile range formula?
IQR = Q₃ − Q₁, the upper quartile minus the lower quartile. Find the quartiles first, then subtract.
How do you find the interquartile range on a box plot?
Read the value at the right-hand end of the box (Q₃) and at the left-hand end (Q₁) and subtract. The line inside the box is the median, and the whiskers reach the minimum and maximum.
How do you find the IQR from a cumulative frequency graph?
For n values, go across from n ÷ 4 on the vertical axis to the curve and down to read Q₁, then do the same from 3n ÷ 4 for Q₃. Subtract. With 80 values, read at 20 and 60.
How do you calculate the interquartile range in Excel?
If the data are in A1:A11, type =QUARTILE.EXC(A1:A11,3)-QUARTILE.EXC(A1:A11,1). Excel also has QUARTILE.INC, which uses a slightly different rule: for the 11 test marks above it gives 26 and 37 instead of 25 and 38. Neither is wrong; they are different conventions.
What does the interquartile range tell you?
How spread out the middle 50% of the data is. If two classes have the same median but different IQRs, the class with the smaller IQR has more similar results.
What is the difference between quartiles, deciles and percentiles?
They are all ways of cutting ordered data into equal parts: quartiles into 4, deciles into 10 and percentiles into 100. Q₁ is the 25th percentile, the median is the 50th and Q₃ is the 75th.
Quick quiz
Quartiles and interquartile range
Check what you know with 5 quick questions.
Question 1 of 5
The lower quartile is 15 and the upper quartile is 27. What is the interquartile range?
Practise it
Try it
Practise box plots and IQR with unlimited questions
Statistics worksheets
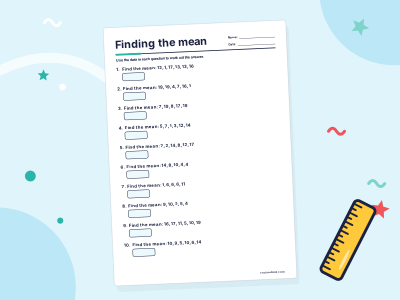
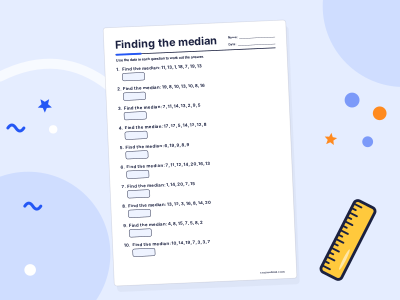
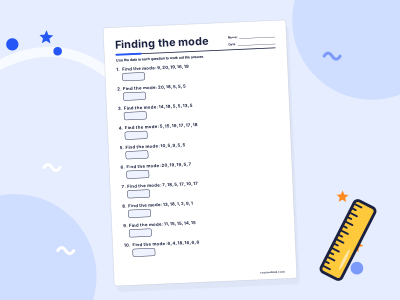
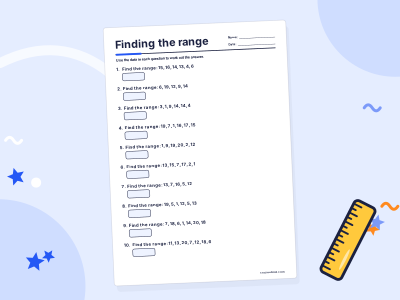
Practise it step by step in a full course: Grade 9 Maths
For grown-ups
Related topics

Mean, median and mode
Mean, median and mode are three kinds of average. The mean shares the total out equally, the median is the middle value in order, and the mode is the most common value.

Cumulative frequency
Cumulative frequency is a running total of frequencies. Add each frequency to the total so far; the last value equals the total, and a cumulative frequency graph gives the median and quartiles.
Variance and standard deviation
Variance and standard deviation measure how spread out data are around the mean. Variance is the mean of the squared distances from the mean; standard deviation is its square root.
The binomial distribution
The binomial distribution B(n, p) gives the probability of k successes in n independent trials, each with success probability p: P(X = k) = ⁿCₖ pᵏ (1 − p)ⁿ⁻ᵏ. Its mean is np.

Conditional probability
Conditional probability is the chance of an event A when you already know event B has happened. It is written P(A|B) and found with P(A|B) = P(A and B) ÷ P(B).
Frequency polygons
A frequency polygon is a line graph of a grouped frequency table. Plot each class's frequency above the class midpoint and join the points with straight lines.