Maths
What is a frequency polygon, and how do you draw one?
Quick answer
A frequency polygon is a line graph of a grouped frequency table. Plot each class's frequency above the class midpoint and join the points with straight lines.



In one sentence
A frequency polygon is a graph made by plotting the frequency of each group of data at the middle of the group and joining the points with straight lines.
Explained
When data is grouped into classes, such as heights 150–160 cm and 160–170 cm, you lose the exact values. You only know how many values fall in each class (the frequency). A histogram shows this with touching bars. A frequency polygon shows the same information with points and lines.
Each class is represented by one point:
- across: the midpoint of the class, midpoint = (lower bound + upper bound) ÷ 2
- up: the frequency of the class
For the class 150 ≤ h < 160 with frequency 8, the midpoint is (150 + 160) ÷ 2 = 155, so you plot the point (155, 8). Then you join the points, in order, with straight lines. Why the midpoint? Inside a class you don't know where the values are, so the middle is the fairest single place to stand for all of them.
 ruler
 pencil
 mountain
If you have already drawn a histogram, there is a shortcut: put a dot at the middle of the top of each bar and join the dots.
Frequency polygons really shine when you compare data. Two histograms on the same axes cover each other up, but two polygons (say, the heights of boys and girls, or test marks for two classes) can sit on one graph in different colours. You can see at a glance which group is higher, which is more spread out and where each one peaks.
Some books close the polygon: they add an empty class at each end, with frequency 0, so the shape starts and ends on the horizontal axis. Others, including most GCSE exam questions in England, just join the plotted points. Follow what your teacher or exam board expects; both show the same data.
Be careful not to mix it up with similar graphs:
- A line graph usually shows how one quantity changes over time. A frequency polygon shows how often each value occurs.
- A cumulative frequency graph (an ogive) plots running totals at the upper class bounds; see cumulative frequency.
- A frequency curve is a smooth curve drawn through the points instead of straight lines, used to show the general shape of a large data set.
Examples
Heights of 30 students:
| Height h (cm) | Frequency | Midpoint | Point to plot |
|---|---|---|---|
| 140 ≤ h < 150 | 3 | 145 | (145, 3) |
| 150 ≤ h < 160 | 8 | 155 | (155, 8) |
| 160 ≤ h < 170 | 11 | 165 | (165, 11) |
| 170 ≤ h < 180 | 6 | 175 | (175, 6) |
| 180 ≤ h < 190 | 2 | 185 | (185, 2) |
Plot the five points and join them with straight lines. The polygon rises to a peak at 165 (the modal class, 160–170 cm) and falls away on both sides. To close it, add (135, 0) and (195, 0), the midpoints of the empty classes 130–140 and 190–200.
You can estimate the mean from the same points: multiply each midpoint by its frequency, add, and divide by the total. Here (145 × 3 + 155 × 8 + 165 × 11 + 175 × 6 + 185 × 2) ÷ 30 = 4,910 ÷ 30 ≈ 163.7 cm. It is only an estimate, because the midpoints stand in for the real heights (more on averages in mean, median and mode).
Common mistakes
- Plotting at the class bounds. Fix: a frequency polygon uses midpoints. Upper bounds are for cumulative frequency graphs.
- Working out the midpoint wrongly. The midpoint of 20 ≤ x < 30 is 25, not 20 or 30. Fix: add the bounds and halve.
- Joining with a curve, or joining the last point back to the first. Fix: straight ruler lines from each point to the next, left to right.
- An uneven scale on the horizontal axis. Fix: the horizontal axis is a number line, so equal steps must be equal distances.
Step by step
Step by step
- Find the midpointsFor each class, add the lower and upper bounds and divide by 2.
- Draw the axesA continuous number scale across that covers all the classes; frequency up the side.
- Plot the pointsOne point per class at (midpoint, frequency).
- Join the pointsUse a ruler to join each point to the next with a straight line.
- Close it if askedAdd a point with frequency 0 at the midpoint of an empty class at each end.
Practice questions
Frequency polygons
Try each one, then check your answer.
- What is the midpoint of the class 10 ≤ x < 20?
Show answer
(10 + 20) ÷ 2 = 15 - What is the midpoint of the class 0 ≤ t < 5?
Show answer
(0 + 5) ÷ 2 = 2.5 - What is the midpoint of the class 150 ≤ h < 160?
Show answer
155 - What is the midpoint of the class 20 ≤ m < 40?
Show answer
(20 + 40) ÷ 2 = 30 - The class 30 ≤ x < 40 has frequency 7. Which point is plotted?
Show answer
(35, 7) - Classes 0–10, 10–20 and 20–30 have frequencies 4, 9 and 5. List the points to plot.
Show answer
(5, 4), (15, 9) and (25, 5) - Classes 10–20, 20–30 and 30–40 have frequencies 2, 6 and 3. Which two extra points close the polygon?
Show answer
(5, 0) and (45, 0) - A frequency polygon has points (25, 4), (35, 10), (45, 7) and (55, 3). What is the total frequency?
Show answer
4 + 10 + 7 + 3 = 24 - For the polygon in question 8, which class has the highest frequency?
Show answer
The peak is at 35, so 30–40 - For the polygon in question 8, what is the class width?
Show answer
35 − 25 = 10 - For the polygon in question 8, how many values are 40 or more?
Show answer
7 + 3 = 10 - A point is plotted at (2.5, 6) and the classes are 5 wide. Which class is it?
Show answer
0 ≤ x < 5, with frequency 6 - Estimate the mean from the polygon in question 8.
Show answer
(25 × 4 + 35 × 10 + 45 × 7 + 55 × 3) ÷ 24 = 930 ÷ 24 = 38.75 - At which horizontal value is the class 40 ≤ x < 60 plotted on (a) a frequency polygon, (b) a cumulative frequency graph?
Show answer
(a) 50, the midpoint; (b) 60, the upper bound
Word problems
Frequency polygons in real life
Try each one, then check your answer.
- Reaction times: 0.2–0.3 s: 5 people, 0.3–0.4 s: 12 people, 0.4–0.5 s: 8 people. Which points do you plot?
Show answer
(0.25, 5), (0.35, 12) and (0.45, 8) - 50 apples were weighed: 100–120 g: 6, 120–140 g: 15, 140–160 g: 20, 160–180 g: the rest. Find the missing frequency and its point.
Show answer
50 − 41 = 9, plotted at (170, 9) - Midday temperatures over 30 days: 10–15 °C: 4 days, 15–20 °C: 11 days, 20–25 °C: 10 days, 25–30 °C: 5 days. On how many days was it 20 °C or warmer?
Show answer
10 + 5 = 15 days - A polygon of bus trip times has points (5, 8), (15, 14), (25, 6) and (35, 2), in minutes. Estimate the mean trip time.
Show answer
(40 + 210 + 150 + 70) ÷ 30 = 470 ÷ 30 ≈ 15.7 minutes - Two classes of 30 sat the same test. Class A's frequency polygon peaks at 65 marks, class B's at 55 marks, and the shapes are similar. Which class generally did better?
Show answer
Class A: its most common marks are about 10 marks higher.
Questions people ask
What is a frequency polygon used for?
It shows the shape of grouped data (where most values are and how spread out they are) and is the best simple graph for comparing two or more data sets on the same axes.
What is the difference between a frequency polygon and a histogram?
They show the same grouped data. A histogram uses touching bars; a frequency polygon uses points at the class midpoints joined by straight lines. Join the midpoints of the tops of a histogram's bars and you get the frequency polygon.
What is the difference between a frequency polygon and a line graph?
A line graph usually shows change over time, such as temperature through a day. A frequency polygon has values (like heights) across the bottom and frequency up the side, so it shows how often each value occurs.
Do you join a frequency polygon to the axis?
It depends on the book. Some textbooks (including India's NCERT books) close it with an empty class at each end; GCSE questions in England usually just join the plotted points. Never join the last point back to the first.
What is the difference between a frequency polygon and an ogive?
A frequency polygon plots each class's frequency at its midpoint. An ogive (cumulative frequency graph) plots running totals at the upper class bounds, so it always goes up.
How do you make a frequency polygon in Excel or Google Sheets?
Put the midpoints in one column and the frequencies in the next. Select both and insert a scatter chart with straight lines (Excel) or a line chart with the midpoints as the x-axis (Google Sheets).
Quick quiz
Frequency polygons
Check what you know with 5 quick questions.
Question 1 of 5
Where do you plot each point of a frequency polygon?
Practise it
Try it
Practise grouped frequency tables with unlimited questions
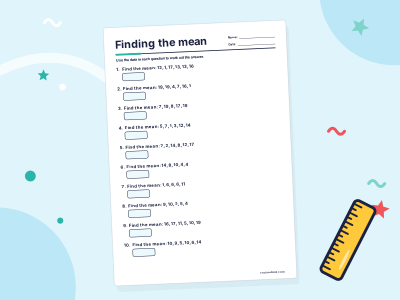
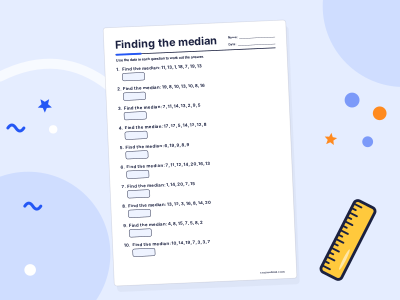
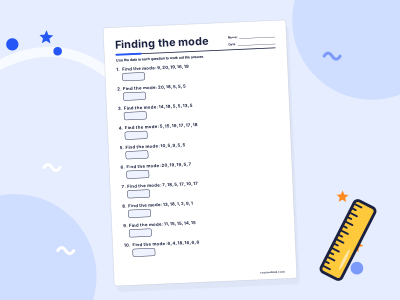
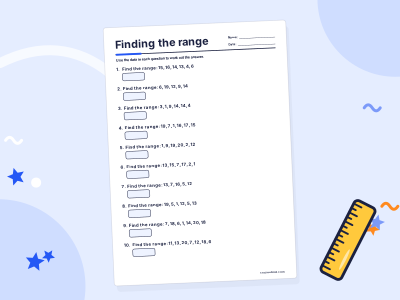
Statistics worksheets
Practise it step by step in a full course: Grade 9 Maths
For grown-ups
Related topics
Histograms
A histogram shows grouped numerical data as touching bars on a number scale, one bar per class. When the classes have different widths, the area of each bar shows the frequency.

Cumulative frequency
Cumulative frequency is a running total of frequencies. Add each frequency to the total so far; the last value equals the total, and a cumulative frequency graph gives the median and quartiles.

Line graphs
A line graph shows how something changes over time. Points are plotted on a grid and joined by a line, so you can see rises, falls and patterns at a glance.

Mean, median and mode
Mean, median and mode are three kinds of average. The mean shares the total out equally, the median is the middle value in order, and the mode is the most common value.
The binomial distribution
The binomial distribution B(n, p) gives the probability of k successes in n independent trials, each with success probability p: P(X = k) = ⁿCₖ pᵏ (1 − p)ⁿ⁻ᵏ. Its mean is np.

Conditional probability
Conditional probability is the chance of an event A when you already know event B has happened. It is written P(A|B) and found with P(A|B) = P(A and B) ÷ P(B).