Maths
What is a line graph?
Quick answer
A line graph shows how something changes over time. Points are plotted on a grid and joined by a line, so you can see rises, falls and patterns at a glance.



In one sentence
A line graph uses points joined by a line to show how a value goes up and down over time.
Explained
A line graph has two axes. The horizontal axis (x) usually shows time: hours, days, months or years. The vertical axis (y) shows the amount you are measuring, such as temperature, height or money. Each piece of data becomes a point where the two meet, and the points are joined with straight lines.
 notebook
 pencil
 ruler
Here is a sunflower measured each week:
| Week | 1 | 2 | 3 | 4 |
|---|---|---|---|---|
| Height (cm) | 5 | 12 | 22 | 35 |
On the graph, the line climbs steadily upward. It is steepest between weeks 3 and 4, where the plant grew 13 cm, compared with 7 cm and 10 cm in the earlier weeks. A flat line would mean no change, and a line that goes down would mean the amount dropped.
To draw a line graph:
Step by step
- Choose scales.Pick equal steps on each axis, like 0, 5, 10, 15 up to 40.
- Label the axes.Write what each shows and the units, such as "Week" and "Height (cm)".
- Plot the points.Find the time on the bottom and the value up the side.
- Join the points.Use a ruler, from left to right.
- Give it a title.
You can also read between the points to estimate: at week 2.5, the plant was about 17 cm tall. Line graphs are good for spotting trends. For separate categories, such as favourite fruit, a bar chart is better. Each point uses coordinates, and the average of the values can be found with the mean.
Examples
| Data | Good for a line graph? |
|---|---|
| Temperature every hour | yes |
| Height of a plant each week | yes |
| Favourite sports | no, use a bar chart |
| Money saved each month | yes |
Common mistakes
- Uneven scales. Each step on an axis must be equal.
- Joining points that should not be joined. Lines only make sense for data that changes over time.
- Missing labels. Without units and titles, the graph does not make sense.
Quick quiz
Line graphs
Check what you know with 4 quick questions.
Question 1 of 4
What does a line graph usually show on the horizontal (x) axis?
Practise it
Try it
Charts and data practice
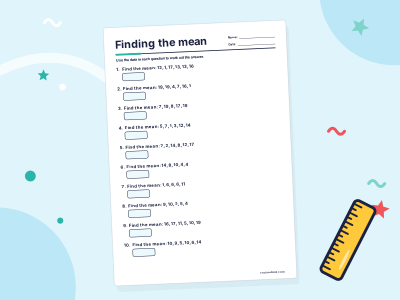
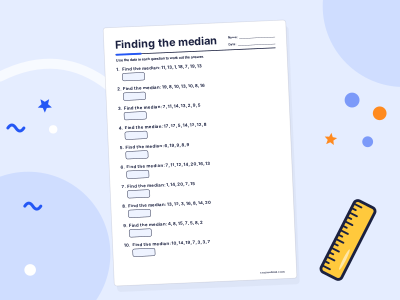
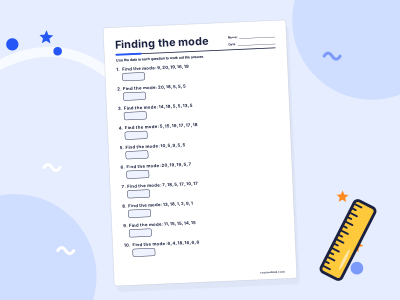
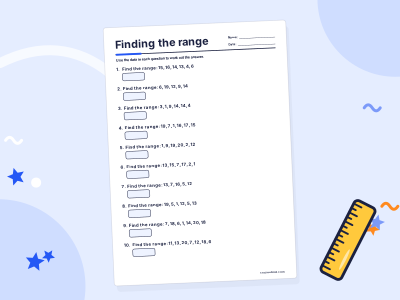
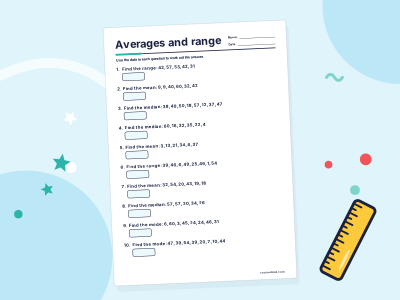
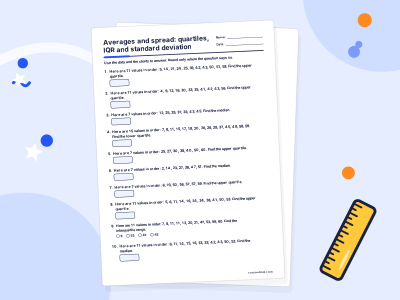
Practise it step by step in a full course: Grade 7 Maths
For grown-ups
Related topics

Bar charts
A bar chart shows data using bars of different lengths. The longer the bar, the bigger the number. In the US it is usually called a bar graph.

Coordinates
Coordinates are a pair of numbers that give an exact position on a grid, like (3, 5). The first number is how far across (x) and the second is how far up (y).

Mean, median and mode
Mean, median and mode are three kinds of average. The mean shares the total out equally, the median is the middle value in order, and the mode is the most common value.

Pie charts
A pie chart is a circle divided into slices that show parts of a whole. A bigger slice means a bigger share, and all the slices together make 100 percent, or 360 degrees.
Tally charts
A tally chart is a table that counts things with little marks. Each mark is one, and every fifth mark crosses the four before it, so you can count in fives.

Venn diagrams
A Venn diagram uses overlapping circles to sort things into groups. The overlap shows what belongs to both groups, and the outside shows what belongs to neither.