Maths
What are variance and standard deviation, and how do you calculate them?
Quick answer
Variance and standard deviation measure how spread out data are around the mean. Variance is the mean of the squared distances from the mean; standard deviation is its square root.


In one sentence
Variance and standard deviation tell you how spread out a set of numbers is: a small value means the data sit close to the mean, a large value means they are scattered far from it.
Explained
Imagine two basketball players who both average 14 points a game. One scores 12, 14 or 16 almost every night. The other scores 4 one night and 24 the next. The mean is the same, but the players are very different. Standard deviation is the number that captures that difference: it measures consistency, or spread.
 football
 ruler
 clock
The idea is to look at how far each value is from the mean. Those distances are called deviations. Some are positive and some are negative, and they always add up to zero, so you cannot simply average them. Instead you square each deviation (which makes it positive), then take the mean of the squares. That is the variance:
σ² = Σ(x − μ)² ÷ n
Variance is in squared units (cm², points²), which is awkward to interpret. So you take the square root to get back to the original units. That is the standard deviation:
σ = √variance
The symbols: σ (the Greek letter sigma) is the standard deviation of a whole population and σ² its variance; for a sample you write s and s². Σ (capital sigma) means "add them all up", μ or x̄ is the mean and n is the number of values.
Population or sample? If your data are the whole group you care about, divide by n. If they are a sample used to estimate a bigger population, divide by n − 1 instead; this gives a slightly larger value and corrects for the fact that a sample tends to underestimate the spread. School exercises usually say which one to use. On this page we divide by n unless a question says "sample".
There is also a quicker formula that avoids working out every deviation: σ² = (Σx² ÷ n) − x̄², "the mean of the squares minus the square of the mean". It gives exactly the same answer and is the one most calculators use.
Examples
Data: 2, 4, 4, 4, 5, 5, 7, 9 (n = 8). The mean is 40 ÷ 8 = 5.
| x | Deviation x − 5 | Squared |
|---|---|---|
| 2 | −3 | 9 |
| 4 | −1 | 1 |
| 4 | −1 | 1 |
| 4 | −1 | 1 |
| 5 | 0 | 0 |
| 5 | 0 | 0 |
| 7 | 2 | 4 |
| 9 | 4 | 16 |
The squares add up to 32. Variance = 32 ÷ 8 = 4. Standard deviation = √4 = 2.
Now the two players over five games. Player A: 10, 12, 14, 16, 18. Player B: 4, 8, 14, 20, 24. Both means are 14. For A the squared deviations are 16, 4, 0, 4, 16 (total 40), so the variance is 8 and the standard deviation is √8 ≈ 2.83. For B they are 100, 36, 0, 36, 100 (total 272), so the variance is 54.4 and the standard deviation is ≈ 7.38. Player A is far more consistent.
Common mistakes
- Forgetting to square the deviations. The plain deviations always add to 0. Fix: square each one before adding.
- Stopping at the variance. Fix: if the question asks for the standard deviation, take the square root at the end.
- Mixing up n and n − 1. Fix: whole population → divide by n; sample → divide by n − 1. On a calculator, σx (or σn) is the population value and sx (or σn−1) is the sample value.
- Squaring the mean in the wrong place. In the quick formula it is (Σx² ÷ n) − x̄², not Σx² ÷ n² or (Σx)² ÷ n alone.
Step by step
Step by step
- Find the meanAdd all the values and divide by how many there are.
- Find each deviationSubtract the mean from every value (x − x̄).
- Square themSquare every deviation so they are all positive.
- Average the squaresAdd the squares and divide by n (or by n − 1 for a sample). This is the variance.
- Square rootTake the square root of the variance to get the standard deviation, in the same units as the data.
For a frequency table, multiply as you go: mean = Σfx ÷ Σf and variance = (Σfx² ÷ Σf) − mean². For grouped data use the midpoint of each class as x; the answer is then an estimate.
Practice questions
Variance and standard deviation
Try each one, then check your answer.
- What is the standard deviation of 4, 4, 4, 4?
Show answer
All values equal the mean, so the spread is 0. - The variance is 25. What is the standard deviation?
Show answer
√25 = 5 - The standard deviation is 3. What is the variance?
Show answer
3² = 9 - Find the variance of 2, 4, 6, 8.
Show answer
Mean 5; squared deviations 9, 1, 1, 9; total 20; 20 ÷ 4 = 5 - Find the standard deviation of 2, 4, 6, 8.
Show answer
√5 ≈ 2.24 (2 d.p.) - Find the standard deviation of 1, 3, 5, 7, 9.
Show answer
Mean 5; squares 16, 4, 0, 4, 16 = 40; variance 8; √8 ≈ 2.83 - Find the standard deviation of 3, 5, 7.
Show answer
Mean 5; squares 4, 0, 4 = 8; variance 8 ÷ 3 ≈ 2.67; σ ≈ 1.63 - Without calculating again, find the standard deviation of 13, 15, 17.
Show answer
It is 3, 5, 7 with 10 added to each value, so the spread is unchanged: ≈ 1.63 - Every value in a data set is doubled. What happens to the standard deviation and the variance?
Show answer
The standard deviation doubles and the variance is multiplied by 4. - Find the standard deviation of 5, 7, 8, 10, 15.
Show answer
Mean 9; squares 16, 4, 1, 1, 36 = 58; variance 11.6; σ = √11.6 ≈ 3.41 - n = 5, Σx = 30 and Σx² = 200. Find the standard deviation.
Show answer
Mean 6; variance 200 ÷ 5 − 6² = 40 − 36 = 4; σ = 2 - Find the sample standard deviation s of 2, 4, 6, 8.
Show answer
Squares total 20; s² = 20 ÷ 3 ≈ 6.67; s ≈ 2.58 - Values 1, 2, 3 have frequencies 2, 5, 3. Find the standard deviation.
Show answer
Σf = 10, Σfx = 21, mean 2.1; Σfx² = 49; variance 4.9 − 4.41 = 0.49; σ = 0.7 - Set A is 48, 50, 52 and set B is 30, 50, 70. Which has the bigger standard deviation?
Show answer
Same mean (50), but B's values are much further from it: set B
Word problems
Spread in real life
Try each one, then check your answer.
- The midday temperatures for a week were 18, 20, 21, 19, 22, 23 and 17 °C. Find the standard deviation.
Show answer
Mean 140 ÷ 7 = 20; squares 4, 0, 1, 1, 4, 9, 9 = 28; variance 4; σ = 2 °C - A snack costs £1.20, £1.40, £1.50 and £1.90 in four shops. Find the standard deviation of the prices.
Show answer
Mean £1.50; squares 0.09, 0.01, 0, 0.16 = 0.26; variance 0.065; σ ≈ £0.25 (2 d.p.) - A test has mean 70 and standard deviation 5. Ana scores 80. How many standard deviations above the mean is she?
Show answer
(80 − 70) ÷ 5 = 2 standard deviations above - A machine fills bags of rice with mean 1000 g and standard deviation 4 g. A bag weighs 992 g. How unusual is that?
Show answer
(992 − 1000) ÷ 4 = −2: it is 2 standard deviations below the mean, quite unusual. - Two runners' 100 m times have the same mean. Runner X has σ = 0.1 s and runner Y has σ = 0.4 s. Who is more consistent?
Show answer
The smaller standard deviation means less spread: runner X
Questions people ask
What is the difference between variance and standard deviation?
Both measure spread. Variance is the mean of the squared deviations, so it is in squared units; standard deviation is the square root of the variance, so it is in the same units as the data and easier to interpret.
What does a large standard deviation mean?
The data are spread out: many values are far from the mean. A small standard deviation means the values are bunched closely around the mean, like a consistent player or a well-tuned machine.
What are the symbols for variance and standard deviation?
σ (sigma) is the population standard deviation and σ² the variance; s and s² are used for a sample. In statistics books you may also see Var(X) for the variance of a random variable.
How do you find the standard deviation on a calculator?
Use the statistics (STAT) mode, enter the data list, and read σx for a population or sx for a sample. On a TI-84, use STAT → CALC → 1-Var Stats.
How do you calculate standard deviation in Excel?
Use =STDEV.P(A1:A10) for a whole population and =STDEV.S(A1:A10) for a sample. VAR.P and VAR.S give the variances.
What is standard deviation used for?
It compares how consistent things are (sports, prices, test scores), measures risk in finance (how much an investment's return moves around), and is the key number in the normal distribution.
Quick quiz
Variance and standard deviation
Check what you know with 4 quick questions.
Question 1 of 4
What is the standard deviation of 5, 5, 5, 5?
Practise it
Try it
Practise variance and standard deviation with unlimited questions
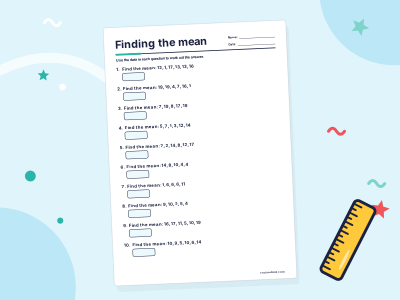
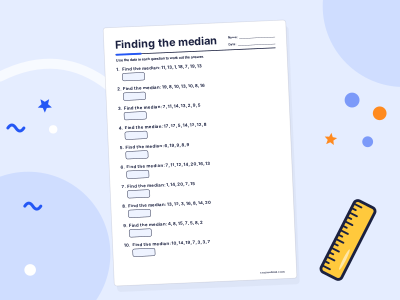
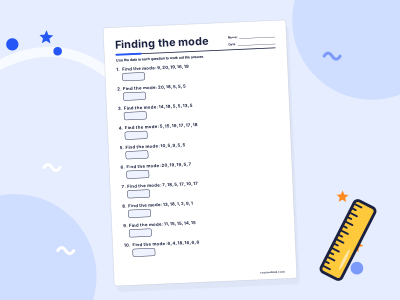
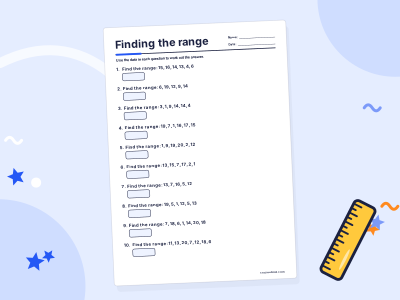
Statistics worksheets
Practise it step by step in a full course: Grade 11 Maths
For grown-ups
Related topics
Mean, median and mode
Mean, median and mode are three kinds of average. The mean shares the total out equally, the median is the middle value in order, and the mode is the most common value.

The normal distribution
The normal distribution is a symmetrical, bell-shaped curve described by its mean μ and standard deviation σ. About 68% of values lie within 1σ of the mean, 95% within 2σ and 99.7% within 3σ.

Bar charts
A bar chart shows data using bars of different lengths. The longer the bar, the bigger the number. In the US it is usually called a bar graph.
The binomial distribution
The binomial distribution B(n, p) gives the probability of k successes in n independent trials, each with success probability p: P(X = k) = ⁿCₖ pᵏ (1 − p)ⁿ⁻ᵏ. Its mean is np.

Quartiles and interquartile range
Quartiles split ordered data into four equal parts. The interquartile range is the upper quartile minus the lower quartile, IQR = Q₃ − Q₁: the spread of the middle half.

Conditional probability
Conditional probability is the chance of an event A when you already know event B has happened. It is written P(A|B) and found with P(A|B) = P(A and B) ÷ P(B).